Airmatics measurement methods and data sampling rate explained
The purpose of this article is to explain how an Airmatics device samples data. This will include how often the Airtag takes a measurement, what
it does with this measurement internally, and how often it sends this data to
the cloud.
Analog input measurements (pressures, temperatures, etc.): 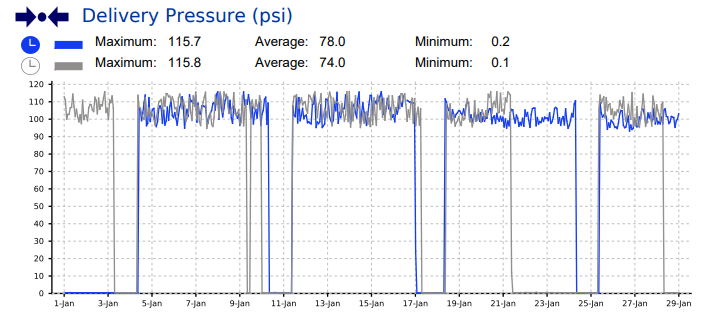
Taking in all of the above information lets look at an example. Suppose within one minute the compressor is loaded for 35 seconds at 30kW and unloaded for another 20 seconds at 10kW:
Additional info:
Practically speaking, there are three types of measurements coming through to an Airmatics device: Analog inputs, digital inputs, and 3-phase power monitoring.
- ed as either current (0 to 20mA) or voltage (0 to 10V) inputs.
- Additionally there are 3 inputs that measure resistance which are used to monitor temperatures.
- All of these values are sampled on the –Tag at a rate of 1 sample/sec
- Data displayed on Aircloud will show 1 sample/min (The
average of 60 samples)
- The 3-phase current and voltage are sampled every 200 micro seconds (hence 5000 times per second)
- Internally the -Tag will accumulate data over 250 milliseconds and calculate:
- RMS voltage per phase
- RMS current per phase
- Phi per phase
- Distortion factor per phase
- Sometimes a fourth CT can be utilized to measure the VSD frequency
- These measurements are based on a low-to-high flank transition times which are taken over a period of 250 milliseconds
- Depending on the mains frequency 50/60HZ there can be 12 to 16 transitions
- Once every second the above measurements are processed and stored. This happens in the same interval that the -Tag records the analog input measurements
- Data displayed on Aircloud will show 1 sample/min (The average of 60 samples)
- Digital inputs are sampled every millisecond and are digitally filtered for noise.
- Note: The digital input can be an AC signal at the main frequency (50/60Hz) and hence, a signal can alternate between "low" and "high" at that frequency. In order to tackle this, the value being "low" for at least 15 milliseconds is detected as low.
- Practically speaking, digital inputs will be measured as they arrive and status changes are shown instantly on Aircloud.
Communication with the cloud (i.e. how long does it take data to appear on the Aircloud dashboard?):
- The -Tag communicates with Aircloud via the cellular gateway
- It sends two types of data:
- Measurements
- Events
- Measurements are sent every minute in a "package"
- All analog values (power, pressures, temperatures) being sent are the arithmetic mean average over one minute
- Digital values are similar, being the majority of measured digital values (for instance measuring 35 times high and 25 times low results in "high")
- Events are sent "as they appear" and are not in sync with the measurement package that comes in every minute
Data representation in PDF reports:
- Reports come in the format of a PDF file
- In the report we see for instance, 1 month of pressure data:
- One month of data contains 43,000 samples (1 week of data contains approximately 10,000 samples)
- Logistically we do not have enough pixels to display all data points
- Practically the graphs span 1000 pixels, and for every pixel a type of average is taken.
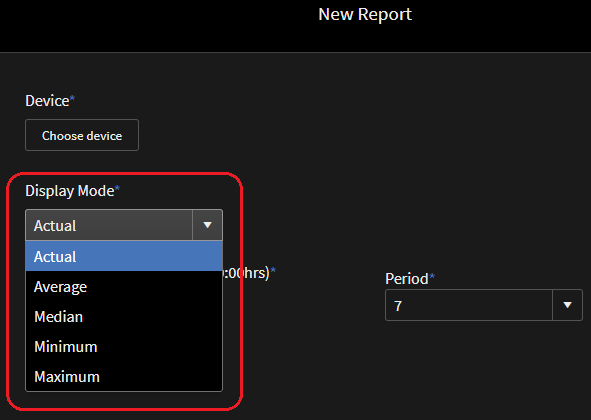
- One can specify the type of averaging the report uses in the Aircloud GUI
- The kW you see on Aircloud will be the average kW within that minute
- You are still able to visualize each instance that it loads/unloads using the status graph along with a counter that keeps track of how many times this occurred within the given timespan. Additionally the load/unload events can be monitored in the events page as they occur.
- When it comes to tracking total load/unload times for the sake of PDF reports or compressor hour counters, the software will see 35 seconds of load time and 25 seconds of unload time and go with the majority. Thus, this will be recorded as 1 minute of load time.
- The list of measurements stored within a -Tag is extensive. For example, Modbus based measurements and cumulative measurements (such as "energy consumption over lifetime") are not really touched on in this article.
- Generally speaking, a -Tag can store many years worth of data in it's memory. However, exact specifications related to this time span can not be guaranteed as it will depend on usage, amount of measurements, efficiency of compression, number of events etc.
Related Articles
Airmatics AERO ModbusRTU Quickstart Guide
Access the Airmatics AERO Modbus RTU Quickstart Guide here. This guide provides all necessary details to read data over ModbusRTU on the Airmatics AERO product. It includes: Connection Setup: Where to connect to the Airmatics AERO product. ...Understanding the "Measurement Data" Report on Aircloud
To generate a measurement data report go to "Show Menu" > "Reports" > "Measurement data" Fill in all of the required fields on the subsequent screen (shown below): When selecting "Type of device" you may choose "device" to generate a report for all ...Airmatics Order: Collection of Data FORM
We know there is a baffling array of choice when embarking on the journey to compressed air performance and health optimization, so thanks’ for choosing Airmatics. We know you will not be disappointed! We want your Airmatics on boarding experience ...Data sampling and time window graphing features
Above every graph there is a pull down menu with various graphing options along with an adjustable time window setting. All graphs will initially display the “Default” option which graphs the data points that are received from the AirTag once every ...How does the Airmatics AERO ensure cybersecurity when integrating with a company's private LAN?
Cybersecurity of Airmatics AERO: Separation of Networks Explained The Airmatics AERO is designed with robust cybersecurity in mind. It features two physically separated Ethernet interfaces to ensure complete isolation between networks: Private LAN, ...